
Showing posts with label Politics. Show all posts
Showing posts with label Politics. Show all posts
Feb 28, 2014
Declining Italian Growth and Governments
Reuters constructed this graph showing economic growth in Italy during the last five decades. Notice the constant declining in the trend growth. Also the beginning of each new government is depicted by the vertical lines.

Dec 21, 2012
2013 Greek Budget: More Austerity
The Greek Government will again implement significant budget cuts in 2013, which it agreed on in November with the Troika. Pensions and state salaries are the main places where the cuts will take place. The reduction in the deficit consists for about 4/5th of budget cuts and 1/5 of tax increases. This total planned tax increases and budget cuts in 2013 are 9.4 billion euro's.
The reduced budget deficit will still increase the government debt however.
Note: the Greek parliament has approved the budget in November.

The reduced budget deficit will still increase the government debt however.
Note: the Greek parliament has approved the budget in November.

Dec 20, 2012
Fiscal Cliff: $607 Billion Automatic Budget Deficit Reduction
Reuters shows in this graph the reduction in the budget deficit that will take place automatically when Democrats and Republicans in Washington don't reach an agreement before the end of the year about how to avoid the fiscal cliff. The biggest part of the reduction comes from the Bush-era tax cuts that expire: 221 billion dollar. Payroll tax relief expiring (95 billion) is also a big tax increase. One of the budget cuts is that Emergency Unemployment benefits will expire.
Will Washington let this happen?
Will Washington let this happen?
 |
| Reuters |
Sep 12, 2012
Dutch Economy in 8 Graphs
With the Dutch elections today this chart may come in handy. The Dutch economy is doing 'better' for most of the indicators than the Euro zone average. Late tonight (local time) the first estimation of the results are expected. A close result between the right party (VVD) and the left party (PVDA) is very likely. A colation needs to be formed to make the new government.
 |
| Reuters |
May 23, 2012
EU Economic & Political Overview
This graph shows per country first the forecasted GDP-growth for 2012, second the unemployment and last the government election date.
 |
| Business Insider |
Apr 19, 2012
Development Aid Spending As a Percentage of GDP
In this graph you can see what percentage of GDP the OECD-countries spent on foreign aid in 2011. As you can see only Sweden, Norway, Luxembourg, Denmark and the Netherlands met the target of 0,7% GDP. Greece, Korea, Japan and Italy spent the least as a percentage of GDP.
 |
| OECD |
Jan 13, 2012
Most Important Elections of 2012
This graphs shows the most important elections of 2012. With in the first place not to forget the United States Presidential Elections (check here for an extensive road map, also with the primaries currently happening) on November 6th. Also globally important are the French presidential elections between mainly Sarkozy and Hollande on April 22nd and May 6th, the Russian presidential elections on March 4th and also the Chinese Party congress where a new leader will be selected in October.
Also check this election calender with all the elections dates and info:
http://www.electionguide.org/calendar.php
Also check this election calender with all the elections dates and info:
http://www.electionguide.org/calendar.php
 |
| The Economist |
Jan 11, 2012
United States 2012 Election Calender
This graph from Reuters shows when the primaries and caucuses are held during the 2012 United States presidential election. At these primaries and caucuses the republicans choose a contender for the presidential elections in November. March six is the big 'Super Tuesday' with 12 states up for grabs.
November six is the presidential election day, when we know whether Obama will get re-elected or the republicans will take over the White House.

Oct 10, 2011
Should The US Raise the Top Marginal Tax Rate?
According to many economists and the IMF the United States needs to raise taxes (accompanying budget cuts!) to attain a sustainable budget in the long run. If the U.S. will stick to the current fiscal policy national debt will increase to 350% in 250. Raising taxes is one of the hardest decisions for a politician because it could very well mean you won't be re-elected. Especially in the Untied States the debate about raising taxes is a very heated one.
This infographic from Gplus is about raising the top marginal tax rate for top earning individuals in the United States. It shows arguments for and against a tax increase, together with historical data on the subject.
This infographic from Gplus is about raising the top marginal tax rate for top earning individuals in the United States. It shows arguments for and against a tax increase, together with historical data on the subject.
 |
| Gplus |
Jun 8, 2011
Map With The Dictators In The World
In this map you can see the countries that currently are ruled by the dictators. Check the source for more information about the countries and their leaders.
 |
| Source: CBS |
Apr 27, 2011
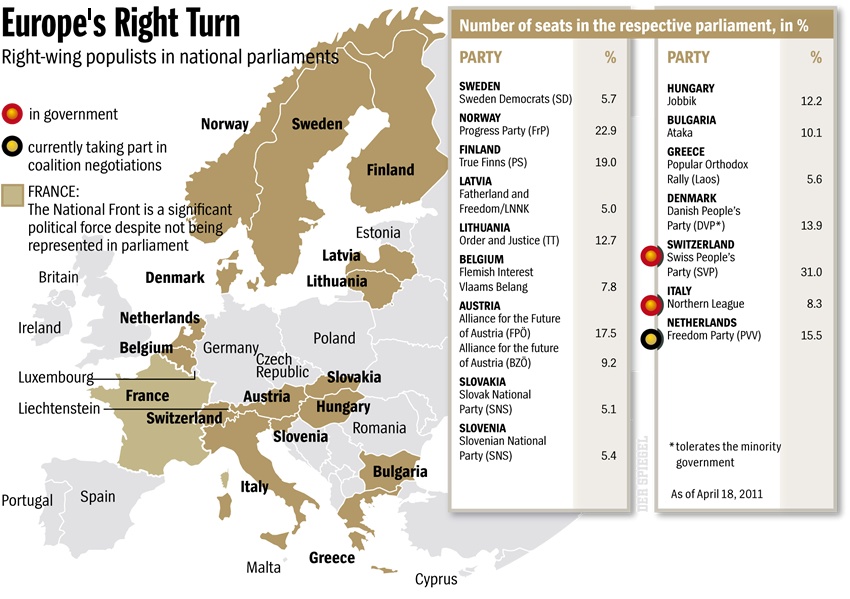
Right Wing Populists in National Parliaments
The picture from Der Spiegel gives the number of seats of the right wing populists in national parliaments in Europe.
(Click for bigger version)
(Click for bigger version)
 |
| Ritholz |
Apr 11, 2011
Rabobank: To default, or not to default
Rabobank economist Shahin Kamalodin wrote a paper about the consequences of a default for governments.
The conclusions are: the economic costs of sovereign default, as estimated by scholars, are found to be less drastic than most believe possible. The political costs of default, on the other hand, are non-negligible.
 |
| http://overons.rabobank.com/content/images/SP1102ska%20To%20default%20or%20not%20to%20default_tcm64-138583.pdf |
Subscribe to:
Posts (Atom)