
Showing posts with label ECB Balance Sheet. Show all posts
Showing posts with label ECB Balance Sheet. Show all posts
Jun 18, 2013
Breakdown of holders of Italian Government Debt
This chart gives a detailed breakdown of the current owners of Italian government debt (Q2 2013). Notice that quite some debt is owned by European Central Banks.


Aug 6, 2012
Banks Bring Money From ECB To ECB
Last month the European Central Bank lowered the bechmark interbank rate from 1 percent to 0,75 percent. The lowest interest rate to date, since the creation of the Euro. Together with this the deposit facility was lowered from 0,25 to 0 percent. All the billions of dollars that the banks with excess money held at the ECB where not getting any interest anymore. As you can see in the graph the deposits at the ECB, held by the banks, lowered dramatically when the ECB stopped giving interest.

It seems the banks moved their money to the current account of the ECB, shown in the next graph. The banks don't get interest with their money at the current account, but it's more convenient than the deposit facility. Since, in contrast to the deposit facility, banks don't need to move their money to the ECB every day at the current account.
It seems the banks moved their money to the current account of the ECB, shown in the next graph. The banks don't get interest with their money at the current account, but it's more convenient than the deposit facility. Since, in contrast to the deposit facility, banks don't need to move their money to the ECB every day at the current account.
 |
| Biflatie |
Jun 20, 2012
ECB Lending to Italian & Spanish Banks
As you can see the lending of the ECB to Italian and Spanish bank spiked recently to new records. Spain's banks already needed more help during the banking crisis and the Great Recession, and is also currently the country which needs the most help from the ECB. It is noticeable that also Italian banks need significant support, because the private sector in Italy by far has not been hit as much as compared to Spain.
 |
Jun 13, 2012
Euro Zone Inflation History (-May 2012)
This chart from Reuters links the Euro Zone inflation with the ECB interest rate from the start of the Euro until May 2012. In May the Euro Zone inflation was at a 15-month low. The interest rate has been at record low rates since the recession in 2009.


Feb 13, 2012
Largest Central Bank Balance Sheets Combined
The first chart shows the size of the four central banks with the biggest balance sheets. In decreasing order: PBoC (Chinese Central Bank), ECB (European Central Bank), Fed (Federal Reserve, USA) and the BoJ (Bank of Japan).
So the Chinese Central Bank has the largest balance sheet of the central banks in the world!

The next four central banks of the top eight with the largest balance sheets in the world are the Bundesbank (Germany), Banque de France, BoE (Bank of England) and the SNB (Swiss National Bank).

In this last graph you can see the balance sheets of the eight central banks combined. Especially after the fall of Lehman balance sheets increased dramatically. This was also the case, although more gradually since the end of 2010 during the still ongoing Euro crisis.
 |
| The Big Picture |
Dec 27, 2011
Central Bank Balance Sheets (ECB, Fed, BoJ, BoE)
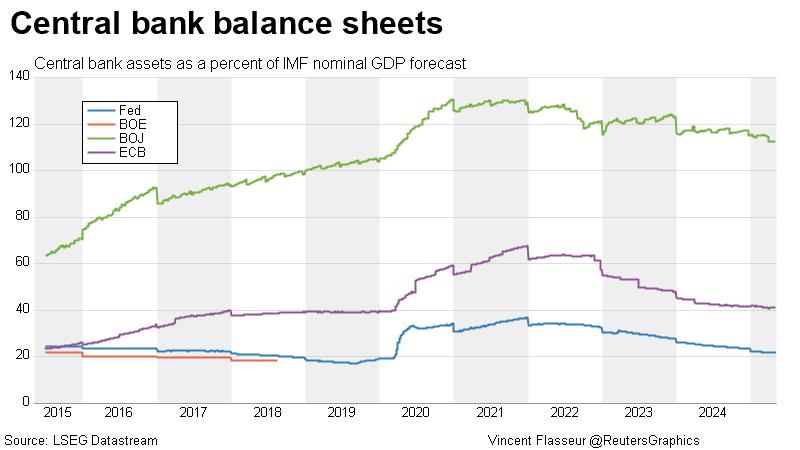
In this post I will show how the main Central Bank balance sheets have grown in the last few years.
First a graph with the assets as a percentage of GDP for the Federal Reserve (U.S.), The European Central Bank, The Bank of England and the Bank of Japan. You can see that especially the assets of the UK and the US central banks have exploded during the financial crisis in the second half of 2008. The balance sheet of the ECB didn't grow as fast but is growing fast at the moment.
The increase in the balance sheets reflect more flexible lending standards by the central banks to the public banks. With the credit markets drying up at the moment (as in 2008) banks more and more stop lending to and from each other and start storing its excess money at the central bank as well as lending from it.
The extra loans given out by the central banks show up as an increase in the central banks balance sheets.
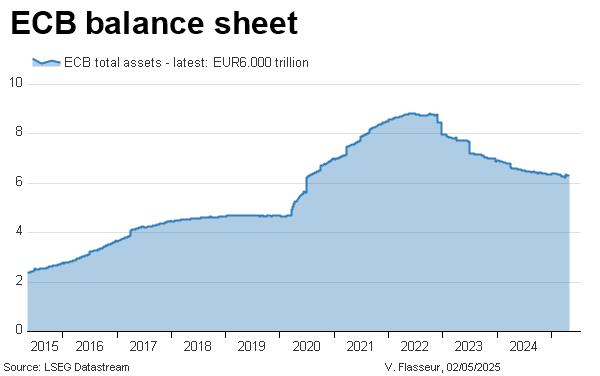
This chart shows the balance sheet of the European Central Bank in trillion euro's. Ofcourse the above picture gives a better comparison as the balance sheets are expressed as percentages of the countries GDP.
First a graph with the assets as a percentage of GDP for the Federal Reserve (U.S.), The European Central Bank, The Bank of England and the Bank of Japan. You can see that especially the assets of the UK and the US central banks have exploded during the financial crisis in the second half of 2008. The balance sheet of the ECB didn't grow as fast but is growing fast at the moment.
The increase in the balance sheets reflect more flexible lending standards by the central banks to the public banks. With the credit markets drying up at the moment (as in 2008) banks more and more stop lending to and from each other and start storing its excess money at the central bank as well as lending from it.
The extra loans given out by the central banks show up as an increase in the central banks balance sheets.
This chart shows the balance sheet of the European Central Bank in trillion euro's. Ofcourse the above picture gives a better comparison as the balance sheets are expressed as percentages of the countries GDP.
May 28, 2011
Collateral deposited at the ECB
The current financial guarantees that the ECB has on it balance sheet are double the size as they were before the crisis. The picture from Der Spiegel graphs what these guarantees consist of.
 |
| Source: Der Spiegel |
Subscribe to:
Posts (Atom)