Google Website Translator Gadget

Showing posts with label Government. Show all posts

Jan 9, 2014

Government Debt for OECD Countries (2015 versus 2007)

This chart by Reuters shows the change in government debt for a lot of developed and emerging EU countries. Note that only two countries are expected to have lower government debt ratios in 2005 compared to 2007. Japan, Greece and Italy are projected to have to highest debt ratio while Estonia is on the bottom of the list. 

Twitter

Dec 20, 2012

Fiscal Cliff: $607 Billion Automatic Budget Deficit Reduction

Reuters shows in this graph the reduction in the budget deficit that will take place automatically when Democrats and Republicans in Washington don't reach an agreement before the end of the year about how to avoid the fiscal cliff. The biggest part of the reduction comes from the Bush-era tax cuts that expire: 221 billion dollar. Payroll tax relief expiring (95 billion) is also a big tax increase. One of the budget cuts is that Emergency Unemployment benefits will expire.

Will Washington let this happen?
Reuters

Sep 17, 2012

United States Federal Income And Expenses (2011)

Income tax and payroll tax (which employers hold from wages, also social security contributions) are the major sources of income for the United States fedral government. 


This income is then used mostly for Medicare, Medicaid, Social Security and Defence.


Jul 5, 2012

Non-financial U.S. Total Debt

This graph, with data from the United States Federal Reserve, shows the total Credit Market Debt Owed. In other words, this is the total debt outstanding in the United States. That includes both public and private debt, with private debt consisting of households, financial companies and non-financial companies.

You can see that since the 1970s the growth of total debt (red line) started to exceed the growth in the national income. Now total market debt is about four times as high as the national income (GDP).


Business Insider

Jun 15, 2012

Euro Zone Bank Depositis (2009 - June 2012)

This graph shows the change in the Euro Zone bank deposits, with start of 2009 as 100. You can see the bank deposits decline especially in Greece and Ireland, already from the end of 2009. Lately this started also to happen in Spain. Italy is still quite stable. France and Portugal saw their deposits rise especially, in contrast to the lower rise in deposits in Germany.

Reuters

May 17, 2012

OECD Government Budget History: Deficit versus surplus

The Economist posted this interesting chart with the budget historty from several countries. On the top a smaller group of countries over a longer time and on the bottom a bigger group of countries over a smaller time. Unfortunately there was no data available for both more countries and over a longer period. What both graphs show though is that most countries had a lot more years with a budget deficit than years with a budget surplus. Many economists advice governments to buildup debt-ratio in a recession and lower the debt-ratio in a boom. Because there were more deficit years that surplus years, this wasn't the case. Overall, in the long run government debt ratio's on average increased.

Due to a request by the Economist this graph has been removed. 

Apr 30, 2012

Spain Sectoral Balance Sheets

Households (since 1997) and the corporate (since 1999) sector massively increased their borrowing. A big part of the financing of the increased borrowing came from the rest of the world that increased it's savings in Spain by a huge amount. On the contrast the Spanish government decreased spending dramatically. During the crisis the government had to step in because of the high rise in private savings (and lower consumption and investments).
Richard Koo

Mar 19, 2012

Economies of Italy and Spain Compared (March 2012)

Before the crises started in 2008 the economy in Spain grew remarkably faster than in Italy. Since the crisis started Spain is still doing relatively better (or rather less bad) again, as you can see in the first graph on the left. While that happened Spain's unemployment, while being almost the same as for Italy in 2007, was more than double the rate of Italy in 2011. Spain again is doing better for the government debt, although it increased a lot more since the crises than in Italy, so the two graphs on the bottom show.

Spain and Italy's bond yields were closely tied in the last five years. In late 2011 Italy's bond yields sparked above that of Spain, but since a few weeks Italy's yields have come down to around Spain's yield again.

Jan 23, 2012

United Kingdom Economy Balance Sheets (Sectors)

This graph shows the financial surplus or deficit by sector for the economy of the United Kingdom. You can see that the government runs structural deficit. This deficit of the government is financed by the private sector and the rest of the world. During the crisis the government deficit exploded. This was not financed by borrowing more from foreigners but only from more private savings.

BBC

Jul 8, 2011

Fiscal Year 2011 Requested Budget

This chart shows the cake of projected government spending by the United States for 2011, proposed in 2010. All the different categories of spending are listed.

Business Insider

May 13, 2011

Dutch: Overheidsuitgaven in 2011

Dit plaatje geeft de verschillende verwachte uitgaven van de Nederlandse overheid in 2011 aan. Klik op de link onder het plaatje voor een interactieve weergave met de componenten van de verschillende uitgaven.

Bron: Overheid

Interest payments for developed countries

Interest payments for developed countries as a percentage of government revenue (2011).

Apr 26, 2011

Greece 2year Government Bonds

The next graph from Bloomberg shows the yield of the 2-year Greek Government Bonds.

The yield has recently exploded to around 23%, which is certainly unsustainable.

Source: Bloomberg

Apr 21, 2011

Part of the Government Debt hold by foreigners

Part of the Government Debt hold by foreigners as a percentage of GDP.

Green = Ireland; Blue = Greece; Dark blue = United States; Yellow = Germany; Red = Japan

Apr 16, 2011

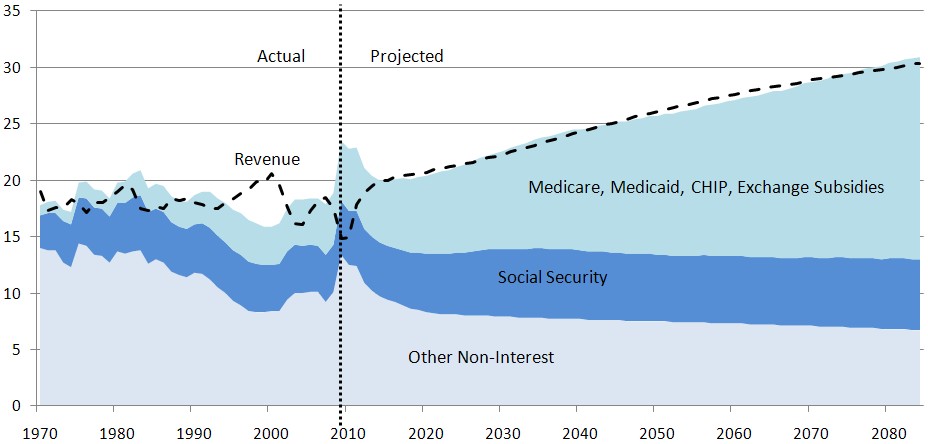
Projection of United States government spending

Via Lukas Daalder Projection of different types of government spending. Notice that Medicare, Madicaid, CHIP and Exchange subsidies will rise sbustantialle from 2020 as a percentage of GDP.

Apr 13, 2011

The Economist:

IMF warns of high spending in Japan and United States, says Europe is on the right track for fiscal consolidation. 


The Economist made a graph with budget defitcit as a percentage of GDP and Gross Government Debt with projection from the IMF WEO Spring 2011. The Economist: 'On April 13th President Barack Obama is set to present yet another plan to reduce the country's mammoth deficit. America's economy is so large, and foreign appetite for greenbacks so voracious, that it seems inconceivable that it could suffer a fate similar to that of Portugal or Greece. The IMF's World Economic Outlook (WEO), published today, aims to shatter such complacency. America, its authors write, lacks a credible strategy for dealing with its growing public debt, and is expanding its budget deficit at a time when it should be shrinking. The chart below, drawn from the WEO, illustrates the size of the problem America faces.'


Source: The Economist

Apr 11, 2011

The Budget Pie Illustrated

Lukas Daalder (follow him on twitter if you are dutch!) from Robeco posted in his daily blog an illustration by Michael Ramirez which illustrates the budget cuts proposed by the democrats and those proposed by the Republicans.

http://daalder.posterous.com/best-links-of-the-web11-04-11-nr-299

Rabobank: To default, or not to default

Rabobank economist Shahin Kamalodin wrote a paper about the consequences of a default for governments.

http://overons.rabobank.com/content/images/SP1102ska%20To%20default%20or%20not%20to%20default_tcm64-138583.pdf

The conclusions are: the economic costs of sovereign default, as estimated by scholars, are found to be less drastic than most believe possible. The political costs of default, on the other hand, are non-negligible.

Apr 10, 2011

Government debt-to-gdp for developed countries

Government Debt-to-GDP ratios for developed countries in 2007, 2010 and 2015 (forecast by IMF).

http://overons.rabobank.com/content/images/SP1102ska%20To%20default%20or%20not%20to%20default_tcm64-138583.pdf
Where the labels are: AU is Australia, AT is Austria, BE is Belgium, CA is Canada, DK is Denmark, FI is Finland, FR is France, DE is Germany, GR is Greece, IS is Iceland, IE is Ireland, IT is Italy, JP is Japan, LU is Luxembourg, NL is the Netherlands, NZ is New Zealand, NO is Norway, PT is Portugal, ES is
Spain, SE is Sweden, CH is Switzerland, GB is the United Kingdom and US is the United States.