 |
| Luxetveritas |
Showing posts with label Norway. Show all posts
Showing posts with label Norway. Show all posts
May 22, 2013
EU House Price Change Since Credit Crisis (2008-2012)
This chart with data from Eurostat shows the average change in the house prices in the EU since the credit crisis really started to break down in the United States, the second half of 2008, until the third quarter of 2012. Countries known for being in a big crisis at the moment saw the largest declines in their house prices, mainly Ireland and Spain. The Netherlands and Denmark have to highest household debt-to-gdp ratio's in the world and saw their house prices declines a lot as well. The last group of countries on the downside are several East-European countries for which Latvia and Lithuania saw big declines. In contrast, three out of four Scandinavia countries had their house prices increase substantially.

Jan 7, 2013
Household Debt Versus Disposable Income (1995-2011)
This graph gives the ratio of total household debt divided by the total of disposable income of the households in countries of the Euro Area and the USA. On average the household debt to income rate was relatively stable in the Euro Area approaching the 100 percent just before the credit crisis from around 70 percent at the beginning of the Euro. The household debt to income ratio was already higher in 1999 in the USA and saw a much bigger increase, but unlike in the Euro Area the ratio has come back quite a lot already in the United States.
The average of around 100 percent currently in the Euro Area is mainly formed by the bigger economies: Germany and France, who have a ratio close to the Euro Area average. There are notable outliners, especially Denmark, The Netherlands and Ireland that have a way bigger ratio of 200 to almost 300 percent.
 ,
The average of around 100 percent currently in the Euro Area is mainly formed by the bigger economies: Germany and France, who have a ratio close to the Euro Area average. There are notable outliners, especially Denmark, The Netherlands and Ireland that have a way bigger ratio of 200 to almost 300 percent.
, Oct 15, 2012
Historical Financial Crises: Percentage Job Losses From Peak
In this graph the percentage job losses from the peaks are shows for several countries during selected financial crises. Finland (1991: year of start of the contraction) saw the biggest decline in employment; almost 20 percent. Compared to Finland (and most other selected countries) the United States job market is currently not doing that bad. For Sweden of the selected countries it took the longest, during its crisis starting in 1991, for the job market the recover to pre-crisis levels, 17,8 years.
 |
| Luxetveritas |
Oct 4, 2012
Scandinavia Versus The Euro Zone
The economies Sweden and Norway in Scandinavia grow faster and both have a lower unemployment rate than the average of the Euro Zone. Fiscal positions are also considrably better in Norway and Sweden. The manufacturing indicator is slowing down for these countries lately as well though.
 |
| Thompson Reuters |
Jul 6, 2012
Oil Consumption (consumers+companies) Per Capita
As you were able to see in the post a few days ago, The United States consumes the most oil of all the countries. Perhaps surprisingly enough, it is not the country with the highest oil consumption per capita. Singapore takes the first spot, with Kuwait and Saudi Arabia second and third. The U.S. only takes the ninth place after two more oil producing countries, two European countries and Canada. Perhaps also surprisingly, Germany is on the bottom of the developed countries.
Update: this chart also shows consumption of companies, like aviation and oil refinery. That's why consumption per capita may be a bit misleading.
Update: this chart also shows consumption of companies, like aviation and oil refinery. That's why consumption per capita may be a bit misleading.
 |
| Oil Consumption Per Capita |
Jul 3, 2012
OECD: Official Versus Effective Retirement Age
The official retirement age is rarely equal to the effective retirement age, the average age the people actually retire. As you can see in this chart the official retirement age can be both higher and lower than the effective retirement age. What is the same for all countries is that the life expectancy was raised and that (assuming an equal or declining birth rate) the work force needs to finance more elderly people. A very reasonable option to do that is by raising the effective retirement age (with the official retirement age).
Japan and Sweden had the highest effective retirement age in 2010, while Austria, France and Belgium (and not Greece) had the lowest effective retirement age.
Japan and Sweden had the highest effective retirement age in 2010, while Austria, France and Belgium (and not Greece) had the lowest effective retirement age.
 |
| The Economist |
May 2, 2012
Hourly Labour Costs European Union Private Sector 2011
This chart with data from Eurostat shows the estimated hourly labour costs in euro's for enterprises with more than 10 employees in the European Union. Norway, Belgium, Sweden, Denmark and France have the highest labour costs. Bulgaria, Romania and Latvia have the lowest costs.

Feb 27, 2012
Most Expensive and Cheapest Cities Around the World
This graph from The Economist shows the cost of living for several cities around the world. New York was taken as a benchmark, for which the cost of living index is 100. As you can see Zurich, Tokyo and Oslo are the most expensive cities in the world. Notice that these three cities are all not in the European Union.
Mumbai and Karachi are among the cheapest cities around the world.
Mumbai and Karachi are among the cheapest cities around the world.
Due to a request by the Economist this graph has been removed.
Jan 4, 2012
OECD Countries: Average Tuition Fees & Grants Received (Public Institutions)
This graph shows the average higher edution public tuition fees in dollars for the year 2004/2005. You can see United States was the most expensive country to study in that year. Australia and Japan come in second. Its the cheapest to study in Turkey, Sweden, Finland, Czech Republic, Norway and Denmark.
In Turkey, Norway, Sweden, Denmark and the Netherlands (almost) every student receives a grant. In Belgium and Japan the least number of student receive a grant.
In Turkey, Norway, Sweden, Denmark and the Netherlands (almost) every student receives a grant. In Belgium and Japan the least number of student receive a grant.
 |
| Source: CBS |
Sep 26, 2011
Change In Unit Labor Costs (Q2 2011)
The next graph shows the change in unit labor costs in some selected countries. According to many unit labor costs is a good measure for labor costs in a country. It is the cost of labor to make one unit of output. The measure increases when wage cost increase and decreases when productivity increases.
The graph is ordered decreasingly by the change in wages. In Norway and Australia unit labor cost rose the most and in Denmark and Austria the least.
The graph is ordered decreasingly by the change in wages. In Norway and Australia unit labor cost rose the most and in Denmark and Austria the least.
 |
| The Economist |
Sep 7, 2011
Euro Zone Second Quarter Economic Growth
This graph shows the economic growth of European Countries in the second quarter of 2011. In France the economy didn't grow or contract compared to the first quarter. Poland had a high growth percentage of 1 percent. Average Euro Area economic growth was 0,2 percent. The growth figures for the PIIGS countries are not available yet.
 |
European Unemployment Pictured
This graph shows the unemployment in Europe with the average unemployment in Europe in the middle (EA17: 17 countries in the Euro Area). Notable countries are Spain with the highest unemployment by far and Norway with the lowest unemployment.
 |
| Economic Pic |
Jul 11, 2011
'The Lost Generation', Youth Unemployment In Eurozone and US
This graph from The Economist compares current youth unemployment rates with the rates before the crisis.
Due to a request by the Economist this graph has been removed.
Jun 8, 2011
EU Corporate Tax Rates
In this graph you can see the current corporate tax rates for the countries in the European Union.
 |
| Source: Adam Smith |
Apr 27, 2011
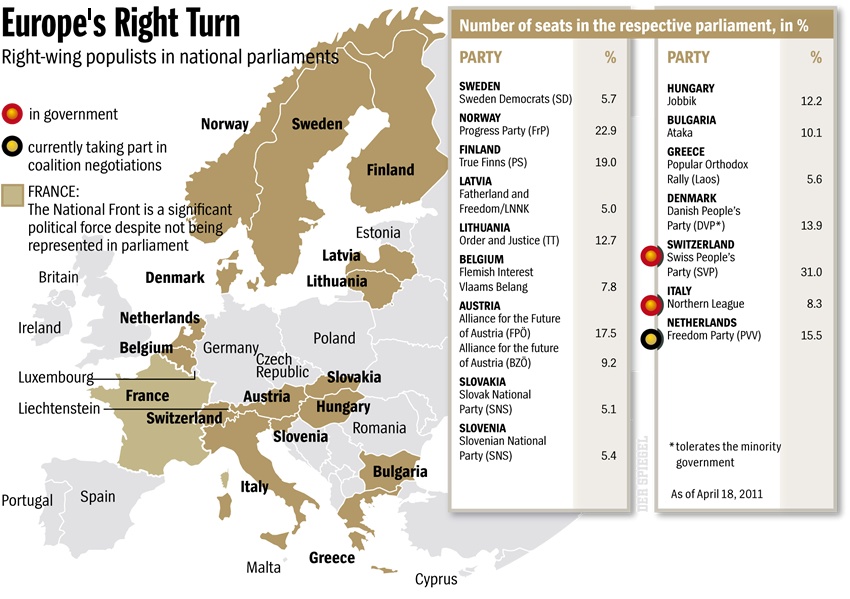
Right Wing Populists in National Parliaments
The picture from Der Spiegel gives the number of seats of the right wing populists in national parliaments in Europe.
(Click for bigger version)
(Click for bigger version)
 |
| Ritholz |
Subscribe to:
Posts (Atom)