 |
| The Big Picture |
Showing posts with label QE. Show all posts
Showing posts with label QE. Show all posts
Jan 5, 2012
Bailout & Stimulus In The World During The Financial Crisis
This infograph shows the sizes of the bailouts and the stimulus (up until the end of 2009) in the world. The grey circles picture the size of the economy of the country in 2008 in dollars. Inside the circle the red part shows the bailout costs as a percentage of GDP and the blue part shows the stimulus amounts as a percentage of GDP.

Dec 27, 2011
Central Bank Balance Sheets (ECB, Fed, BoJ, BoE)
In this post I will show how the main Central Bank balance sheets have grown in the last few years.
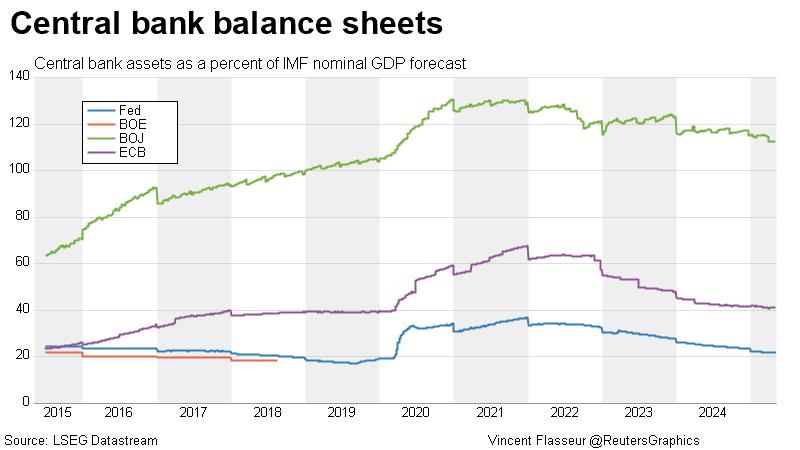
First a graph with the assets as a percentage of GDP for the Federal Reserve (U.S.), The European Central Bank, The Bank of England and the Bank of Japan. You can see that especially the assets of the UK and the US central banks have exploded during the financial crisis in the second half of 2008. The balance sheet of the ECB didn't grow as fast but is growing fast at the moment.
The increase in the balance sheets reflect more flexible lending standards by the central banks to the public banks. With the credit markets drying up at the moment (as in 2008) banks more and more stop lending to and from each other and start storing its excess money at the central bank as well as lending from it.
The extra loans given out by the central banks show up as an increase in the central banks balance sheets.
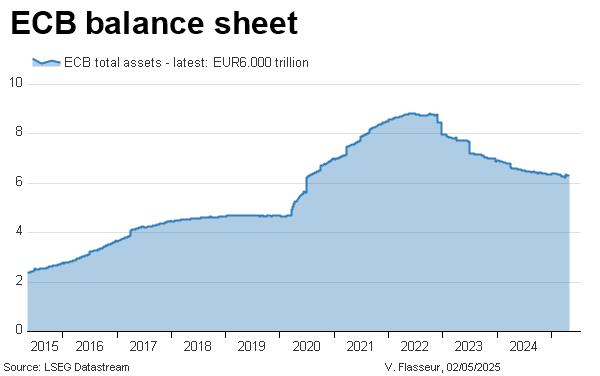
This chart shows the balance sheet of the European Central Bank in trillion euro's. Ofcourse the above picture gives a better comparison as the balance sheets are expressed as percentages of the countries GDP.
First a graph with the assets as a percentage of GDP for the Federal Reserve (U.S.), The European Central Bank, The Bank of England and the Bank of Japan. You can see that especially the assets of the UK and the US central banks have exploded during the financial crisis in the second half of 2008. The balance sheet of the ECB didn't grow as fast but is growing fast at the moment.
The increase in the balance sheets reflect more flexible lending standards by the central banks to the public banks. With the credit markets drying up at the moment (as in 2008) banks more and more stop lending to and from each other and start storing its excess money at the central bank as well as lending from it.
The extra loans given out by the central banks show up as an increase in the central banks balance sheets.
This chart shows the balance sheet of the European Central Bank in trillion euro's. Ofcourse the above picture gives a better comparison as the balance sheets are expressed as percentages of the countries GDP.
Jul 8, 2011
Impact of QE on 10-year Treasury
Interesting graph with all the relevant dates of QE1 and QE2 in relating to the interest rate on 10 year treasuries.
 |
| Business Insider |
Jun 25, 2011
Did QE Affect Stocks (S&P 500)
Graph with the S&P 500 between January 2008 and April 2011 with the main data of Quantitative Easing. Quantitative Easing is a policy of the Federal Reserve in which the National Bank bought United States Treasuries to bring interest rates down in other words to combat deflation and bring unemployment down. The current quantittative easing (i.e. QE2) will come to an end on July 1st 2011.
 |
| Calculated Risk |
Jun 10, 2011
QE2 In Relation To Leading Indicators
Business Insider made four charts comparing Quantitative Easing 2 with unemployment, consumer credit, housing market and inflation expectations. During QE2 Unemployment, Consumer Credit and the Housing Market didn't improve under QE2. Inflation expectations on the other hand did improve.


May 21, 2011
Did QE increase the Money Supply?
This graph shows that in the United States the relationship between the monetary base and the money supply breaks down during the crisis. In other words, QE barely rose the money supply.
 |
| Source: Business Insider |
.
Subscribe to:
Posts (Atom)