 |
| Business Insider |
Showing posts with label European Central Bank. Show all posts
Showing posts with label European Central Bank. Show all posts
Aug 29, 2014
Why Draghi Changed His Tone at Jackson Hole
Draghi's speech at Jackson Hole was different compared to his last speech at the ECB's governing council meeting. The ECB has a mandate of inflation just under two percent. What Draghi always underlines in this speeches is that, while inflation in the short run may deviate from the target, inflation expectations are at just below 2 percent. What you can see in the next graph is that inflation expectations have actually been declining quite fast. This probably was the reason Draghy changed his tone.

May 20, 2014
Deflation Heat Map Spring 2014
Dankse bank made this interesting deflation heat map. Showing overall as well as components of the HICP (euro-wide definition of the) inflation rate. Greece even faces deflation of 1.8 percent. Portugal has a minor negative inflation rate of 0.1 percent. The Euro Zone as a whole saw prices rise with 0.7 percent.
 |
| Danske Bank |
Apr 4, 2014
Euro Zone Inflation 2008 - Q1 2014
This graph by the Wall Street Journal shows inflation in the Euro Zone from 2007 until the most recent data. Since 2012 a downward trend has started. With Spanish inflation even becoming negative, the inflation rate in the Euro Zone is nearing it's lowest rate since 2010. Will the ECB act to get inflation closer to it's target of just below 2 percent?
 |
Aug 19, 2013
History of EU/Euro Zone (1929-2013)
Large overview of the history of the EU and the implementation of the Euro. From the first suggestion for a common European currency in 1929 until Croatia joining the EU in the beginning of 2013.


Jun 18, 2013
Breakdown of holders of Italian Government Debt
This chart gives a detailed breakdown of the current owners of Italian government debt (Q2 2013). Notice that quite some debt is owned by European Central Banks.


Dec 18, 2012
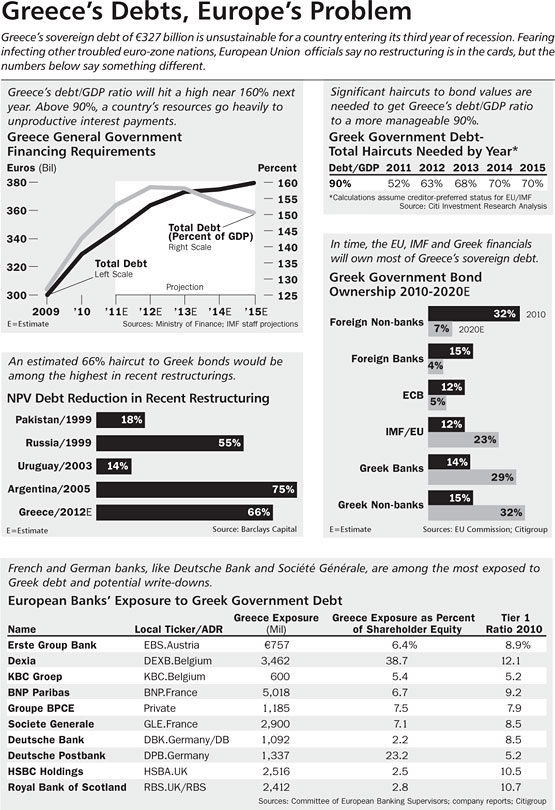
Greek Debt Composition 2012
One reason the Northern European countries bailout out Greece was because banks, for example German en French banks, heavily invested in Greek government debt. Since then the European Commission (EFSF) and the ECB have bought quite a lot of debt from the banks. This means that the bond holders of Greek debt shifted from only private parties to mostly public holders now.
This means that when there would be a second round of writedowns on Greek debt the European tax payer will have to pay as well.

This means that when there would be a second round of writedowns on Greek debt the European tax payer will have to pay as well.

Nov 6, 2012
Some Convergence Actually Took Place In The Euro Zone
This graph, from a presentation of the ceo of the Dutch Central Bank, shows that some convergence actually took place since the implementation of the Euro. The graph shows the difference in the growth of the listed countries with the growth of Germany. Especially Ireland, Greece and Spain grew a lot faster than Germany. In 2007 that difference was even 40 percent for Ireland, cumulatively. Portugal and Italy were not able to generate more growth than Germany.
One of the causes for this convergence may be that Ireland, Spain and Greece saw their real interest rate decline significantly. This graph shows that the extra growth was actually partly financed with borrowed money:
Also this was accompanied by inflation:
 |
| DNB |
One of the causes for this convergence may be that Ireland, Spain and Greece saw their real interest rate decline significantly. This graph shows that the extra growth was actually partly financed with borrowed money:
 |
| DNB |
 |
| DNB |
Aug 6, 2012
Banks Bring Money From ECB To ECB
Last month the European Central Bank lowered the bechmark interbank rate from 1 percent to 0,75 percent. The lowest interest rate to date, since the creation of the Euro. Together with this the deposit facility was lowered from 0,25 to 0 percent. All the billions of dollars that the banks with excess money held at the ECB where not getting any interest anymore. As you can see in the graph the deposits at the ECB, held by the banks, lowered dramatically when the ECB stopped giving interest.

It seems the banks moved their money to the current account of the ECB, shown in the next graph. The banks don't get interest with their money at the current account, but it's more convenient than the deposit facility. Since, in contrast to the deposit facility, banks don't need to move their money to the ECB every day at the current account.
It seems the banks moved their money to the current account of the ECB, shown in the next graph. The banks don't get interest with their money at the current account, but it's more convenient than the deposit facility. Since, in contrast to the deposit facility, banks don't need to move their money to the ECB every day at the current account.
 |
| Biflatie |
Jun 13, 2012
Euro Zone Inflation History (-May 2012)
This chart from Reuters links the Euro Zone inflation with the ECB interest rate from the start of the Euro until May 2012. In May the Euro Zone inflation was at a 15-month low. The interest rate has been at record low rates since the recession in 2009.


Apr 2, 2012
Italy & Spain Main Users First LTRO
This graph from a BIS report (European bank funding and deleveraging) shows on the left for which amount in billion euro's banks of the countries in the Euro Zone have used the first 'Longer Term Refinancing Operation' 3 year loans of the European Central Bank.


The second graph shows how the banks have changed their holdings of government debt in the three months after the LTRO. It seems Italy and Spain have used the LTRO money partly to buy government debt. As seen by the large decrease in the interest rates of the government bonds of these two countries in the given period it is most likely the bonds that the banks bought were Spanish and Italian.
Feb 13, 2012
Largest Central Bank Balance Sheets Combined
The first chart shows the size of the four central banks with the biggest balance sheets. In decreasing order: PBoC (Chinese Central Bank), ECB (European Central Bank), Fed (Federal Reserve, USA) and the BoJ (Bank of Japan).
So the Chinese Central Bank has the largest balance sheet of the central banks in the world!

The next four central banks of the top eight with the largest balance sheets in the world are the Bundesbank (Germany), Banque de France, BoE (Bank of England) and the SNB (Swiss National Bank).

In this last graph you can see the balance sheets of the eight central banks combined. Especially after the fall of Lehman balance sheets increased dramatically. This was also the case, although more gradually since the end of 2010 during the still ongoing Euro crisis.
 |
| The Big Picture |
Dec 27, 2011
Central Bank Balance Sheets (ECB, Fed, BoJ, BoE)
In this post I will show how the main Central Bank balance sheets have grown in the last few years.
First a graph with the assets as a percentage of GDP for the Federal Reserve (U.S.), The European Central Bank, The Bank of England and the Bank of Japan. You can see that especially the assets of the UK and the US central banks have exploded during the financial crisis in the second half of 2008. The balance sheet of the ECB didn't grow as fast but is growing fast at the moment.
The increase in the balance sheets reflect more flexible lending standards by the central banks to the public banks. With the credit markets drying up at the moment (as in 2008) banks more and more stop lending to and from each other and start storing its excess money at the central bank as well as lending from it.
The extra loans given out by the central banks show up as an increase in the central banks balance sheets.

This chart shows the balance sheet of the European Central Bank in trillion euro's. Ofcourse the above picture gives a better comparison as the balance sheets are expressed as percentages of the countries GDP.

First a graph with the assets as a percentage of GDP for the Federal Reserve (U.S.), The European Central Bank, The Bank of England and the Bank of Japan. You can see that especially the assets of the UK and the US central banks have exploded during the financial crisis in the second half of 2008. The balance sheet of the ECB didn't grow as fast but is growing fast at the moment.
The increase in the balance sheets reflect more flexible lending standards by the central banks to the public banks. With the credit markets drying up at the moment (as in 2008) banks more and more stop lending to and from each other and start storing its excess money at the central bank as well as lending from it.
The extra loans given out by the central banks show up as an increase in the central banks balance sheets.
This chart shows the balance sheet of the European Central Bank in trillion euro's. Ofcourse the above picture gives a better comparison as the balance sheets are expressed as percentages of the countries GDP.
Dec 13, 2011
Interest Rates (global), Inflation (global) and Credit Growth (EuroZone)
World short term interest rates have been lowered drastically by the central banks.

This couldn't stop a dramatic fall in global inflation rates in 2008 and 2009. In 2010 and 2011 inflation rates started growing again, until recently.

Euro Zone Credit Growth. With the financial crisis, followed by the economic crisis (recession) and the sovereign debt crisis resulted in an almost stagnant credit growth in the Euro Zone.

This couldn't stop a dramatic fall in global inflation rates in 2008 and 2009. In 2010 and 2011 inflation rates started growing again, until recently.
Euro Zone Credit Growth. With the financial crisis, followed by the economic crisis (recession) and the sovereign debt crisis resulted in an almost stagnant credit growth in the Euro Zone.

Nov 9, 2011
Greek Rescue Deal & EFSF Enlargement Graphed
Key Points:

- Private sector writes off 50% of Greek Government debt.
- EFSF bailout fund scaled up to 1 trillion.
- European Banks to be recapitalized with 100 billion euros.
- Second bailout-package for Greece is 130 billion euros with EFSF-money, instead of 109 billion agreed in July 2011.
Sep 20, 2011
Cumulative ECB Government Bond Purchases
This graph from the Wall Street Journal shows the cumulative bond purchases (this policy is called the securities markets programme) by the Earopean Central Bank of the PIIGS countries. In the last few weeks (Italy and Spain under pressure) the ECB has already bought more government bonds than in the first two months it started buying government bonds (Greece under pressure) in 2010.
 |
Aug 31, 2011
Eurozone Future According To J.P. Morgan
ZeroHedge published this graph from J.P. Morgan which visualizes one scenario of the future of the Eurozone in a war map.
- ECB purchases bonds in secondary market.
- EFSF expanded to 440bn Euros - expected to happen this fall.
- EFSF will lend to Spain and italy.
- Increase EFSF to 1.0-1.5 trillion.
- EU asks IMF to increase its share in the EFSF fund.
- Allow EFSF to the rated AA, to increase its lending capacity.
- Same as 4.
- Eurobonds.
 |
| ZeroHedge |
Jun 22, 2011
Holders of Greece, Ireland and Portugal Debt
'Who holds the sovereign debt of Greece, Ireland and Portugal? Not an easy question. So, RBC Capital Markets compiled figures and MarketBeat/WSJ published them. Bellow, are the charts of the estimated debt exposure.'

 |
| LisWires |
May 28, 2011
Collateral deposited at the ECB
The current financial guarantees that the ECB has on it balance sheet are double the size as they were before the crisis. The picture from Der Spiegel graphs what these guarantees consist of.
 |
| Source: Der Spiegel |
Apr 21, 2011
Salaries of Central Bankers around the world
The one with the most influence, Ben Bernanke, earns a lot less than the others.
 |
| Source: RTLZ |
Subscribe to:
Posts (Atom)