 |
| Calculated Risk |
Showing posts with label Recessions. Show all posts
Showing posts with label Recessions. Show all posts
Jul 11, 2011
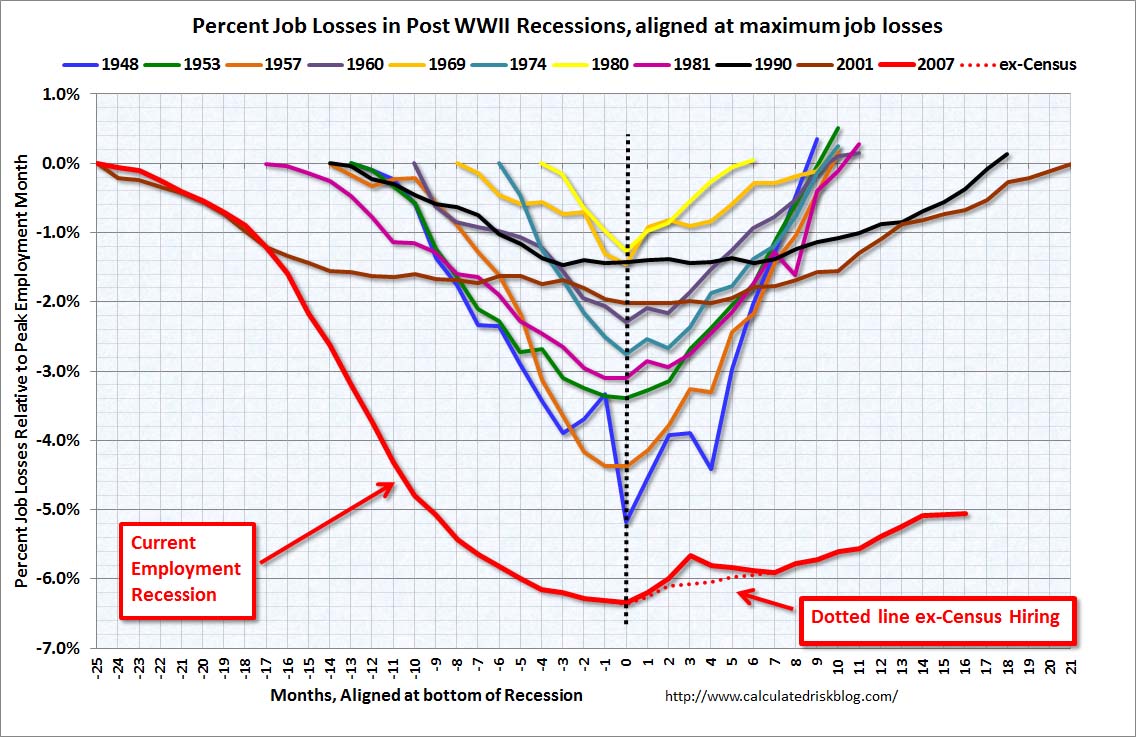
United States Jobs: Post WWII Recessions Compared
The graph from Calculatend Risk shows the percentage job losses for each post WWII recession in the United States. For each recession the lowest point in employment is in the middle of the graph. This jobs recession is by far the worst so far and recent data suggest that unemployment won't come down fast any time soon.

May 23, 2011
What Does The United States Public Debt Consist Of?
The Public Debt is the Gross Debt minus funds held by the government. This picture shows what made the public debt grow so fast in the last few years and how it will keep growing in the coming years.
| Source: De Long |
Apr 25, 2011
Percent Job Losses in Post WWII-Recessions
Great unemployment graph by Calculated Risk with shows the Percent Job Losses in Post WWII Recession, with the last recession clearly as the worst.
 |
| Source: Calculated Risk |
Subscribe to:
Posts (Atom)