
Showing posts with label Euro Launch. Show all posts
Showing posts with label Euro Launch. Show all posts
Aug 19, 2013
History of EU/Euro Zone (1929-2013)
Large overview of the history of the EU and the implementation of the Euro. From the first suggestion for a common European currency in 1929 until Croatia joining the EU in the beginning of 2013.


Nov 6, 2012
Some Convergence Actually Took Place In The Euro Zone
This graph, from a presentation of the ceo of the Dutch Central Bank, shows that some convergence actually took place since the implementation of the Euro. The graph shows the difference in the growth of the listed countries with the growth of Germany. Especially Ireland, Greece and Spain grew a lot faster than Germany. In 2007 that difference was even 40 percent for Ireland, cumulatively. Portugal and Italy were not able to generate more growth than Germany.
One of the causes for this convergence may be that Ireland, Spain and Greece saw their real interest rate decline significantly. This graph shows that the extra growth was actually partly financed with borrowed money:
Also this was accompanied by inflation:
 |
| DNB |
One of the causes for this convergence may be that Ireland, Spain and Greece saw their real interest rate decline significantly. This graph shows that the extra growth was actually partly financed with borrowed money:
 |
| DNB |
 |
| DNB |
Aug 1, 2012
German trade surplus increased fourfold Since Euro
This graph illustrates the positive effects of the monetary union Germany enjoyed since the introduction of the Euro. Germany's trade surplus increased by a fourfold since 1999.
 |
| Sudden Debt |
Jul 9, 2012
Spanish 10-year Bond Yield History (1821-2012)
This graph shows the Spanish bond yield (10-year) history. The historical average interest rate seems to be around 8 percent. A rate, which the Spanish bonds haven't reached yet since the introduction of the Euro.
 |
| The Big Picture |
Apr 23, 2012
Sectoral Balance Sheets Euro Zone
This chart from the OECD shows per sector the net lending/borrowing for the Euro Zone. As you can see the household and the financial sectors are net lending sectors and the non-financial corporations and governments are net borrowing sectors. This means for example for the households that they save more than they borrow for a sector as a whole. This doesn't mean that the borrowing of the households doesn't increase on the other hand.
The total economy shows the net lending/borrwing of the total Euro Zone economy. In other words when the Euro Zone as a total economy is borrowing, it borrows from the rest of the world, which was the case before the crisis.
Before the crisis households en companies increased their borrowing notably. Since the crisis households and companies started do pay off their debt. Although as you were able to see in other posts this is a long process. The lower demand by the households and the companies was accommodated by an increase in government spending (higher borrowing).
 |
| OECD |
Jan 27, 2012
Unemployment in Germany, Spain & EU Compared
You can see before the introduction of the euro the unemployment rates in Spain and Germany converged. Until recently Spain and Germany both had their unemployment rate around the average of the European Union. Over the last two decades on average Spain's unemployment rate was about just under 15%. Germany on the other hand had on average an unemployment rate of about 9 percent.
Since the crisis Spain's unemployment rose dramatically. Its now more than double the average in the European Union. In Germany the unemployment even decreased since the crisis. Germany's unemployment hasn't been this low for twenty years.

Since the crisis Spain's unemployment rose dramatically. Its now more than double the average in the European Union. In Germany the unemployment even decreased since the crisis. Germany's unemployment hasn't been this low for twenty years.

Dec 28, 2011
Dollars per Euro Exchange Rate (1999-2011)
The graph shows the euro/dollar exchange rate. In other words it shows how many dollars you get with one euro. Currently you get 1,30 dollar for one euro.
The average exchange rate since the launch of the euro was 1,20 dollar per euro.

The average exchange rate since the launch of the euro was 1,20 dollar per euro.
Dec 27, 2011
Central Bank Balance Sheets (ECB, Fed, BoJ, BoE)
In this post I will show how the main Central Bank balance sheets have grown in the last few years.
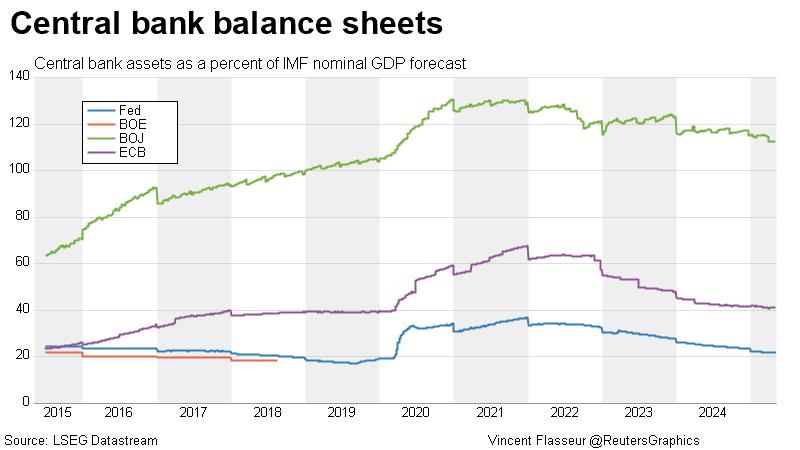
First a graph with the assets as a percentage of GDP for the Federal Reserve (U.S.), The European Central Bank, The Bank of England and the Bank of Japan. You can see that especially the assets of the UK and the US central banks have exploded during the financial crisis in the second half of 2008. The balance sheet of the ECB didn't grow as fast but is growing fast at the moment.
The increase in the balance sheets reflect more flexible lending standards by the central banks to the public banks. With the credit markets drying up at the moment (as in 2008) banks more and more stop lending to and from each other and start storing its excess money at the central bank as well as lending from it.
The extra loans given out by the central banks show up as an increase in the central banks balance sheets.
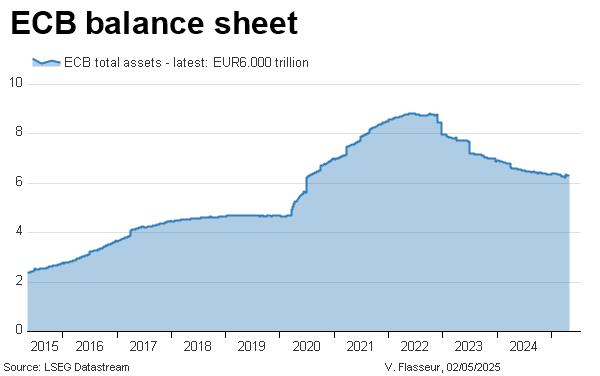
This chart shows the balance sheet of the European Central Bank in trillion euro's. Ofcourse the above picture gives a better comparison as the balance sheets are expressed as percentages of the countries GDP.
First a graph with the assets as a percentage of GDP for the Federal Reserve (U.S.), The European Central Bank, The Bank of England and the Bank of Japan. You can see that especially the assets of the UK and the US central banks have exploded during the financial crisis in the second half of 2008. The balance sheet of the ECB didn't grow as fast but is growing fast at the moment.
The increase in the balance sheets reflect more flexible lending standards by the central banks to the public banks. With the credit markets drying up at the moment (as in 2008) banks more and more stop lending to and from each other and start storing its excess money at the central bank as well as lending from it.
The extra loans given out by the central banks show up as an increase in the central banks balance sheets.
This chart shows the balance sheet of the European Central Bank in trillion euro's. Ofcourse the above picture gives a better comparison as the balance sheets are expressed as percentages of the countries GDP.
Dec 20, 2011
Euro Zone Bond Spreads Above Historical Levels Part 2 (Since 1970)
Three weeks ago I posted this overview of government bond spreads for the PIIGS compared to Germany:
http://www.economicsinpictures.com/2011/11/house-prices-around-world-us-house.html
That chart went back to 1990. This one goes back to 1970 and has much more data for Greece. You can see that in the 80s bond spreads were particularly high as well.

http://www.economicsinpictures.com/2011/11/house-prices-around-world-us-house.html
That chart went back to 1990. This one goes back to 1970 and has much more data for Greece. You can see that in the 80s bond spreads were particularly high as well.

Dec 19, 2011
Overview of the Deficit And Debt History for Euro Zone (2000-2010)
The next two chart give a great overview of the government finances in the first decade of this century in the Euro Zone. It also shows which countries broke the rules of the Stability and Growth Pact. Which says countries can't have deficits higher than three percent and debt higher than sixty percent, both as a percentage of GDP.
Before the crisis Ireland, Spain, Estonia, Luxembourgh and Finland were the only countries that never broke the rules. Especially notice France and Germany, which both had a debt higher than 60% every year since 2003. France had a deficit higher than 3% for 2002-2004 and Germany for 2001-2005.
This chart shows the deficits per year for all the Euro Zone countries from 2000-2010.

This chart shows how the government debt changed per year for all the Euro Zone countries from 2000-2010.
Before the crisis Ireland, Spain, Estonia, Luxembourgh and Finland were the only countries that never broke the rules. Especially notice France and Germany, which both had a debt higher than 60% every year since 2003. France had a deficit higher than 3% for 2002-2004 and Germany for 2001-2005.
This chart shows the deficits per year for all the Euro Zone countries from 2000-2010.
This chart shows how the government debt changed per year for all the Euro Zone countries from 2000-2010.
 |
| Macrobusiness |
Dec 13, 2011
Interest Rates (global), Inflation (global) and Credit Growth (EuroZone)
World short term interest rates have been lowered drastically by the central banks.

This couldn't stop a dramatic fall in global inflation rates in 2008 and 2009. In 2010 and 2011 inflation rates started growing again, until recently.

Euro Zone Credit Growth. With the financial crisis, followed by the economic crisis (recession) and the sovereign debt crisis resulted in an almost stagnant credit growth in the Euro Zone.

This couldn't stop a dramatic fall in global inflation rates in 2008 and 2009. In 2010 and 2011 inflation rates started growing again, until recently.
Euro Zone Credit Growth. With the financial crisis, followed by the economic crisis (recession) and the sovereign debt crisis resulted in an almost stagnant credit growth in the Euro Zone.

Subscribe to:
Posts (Atom)